Data
library(scater)
library(SingleCellExperiment)
library(ggthemes)
library(ggplot2)
library(ggridges)
library(plyr)
library(raster)
library(gridExtra)
library(sp)
library(spatstat)
library(uwot)
library(pheatmap)
#source("R/image_analysis_function.R")
set.seed(2020)
Keren et al.
load("data/mibiSCE.rda")
mibi.sce
## class: SingleCellExperiment
## dim: 49 201656
## metadata(0):
## assays(1): mibi_exprs
## rownames(49): C Na ... Ta Au
## rowData names(4): channel_name is_protein hgnc_symbol wagner_overlap
## colnames: NULL
## colData names(36): SampleID cellLabelInImage ...
##   Survival_days_capped_2016.1.1 Censored
## reducedDimNames(0):
## altExpNames(0):cat("Patients information")
## Patients informationtable(mibi.sce$SampleID)
##
##    1    2    3    4    5    6    7    8    9   10   11   12   13   14   15   16
## 5167 3028 6315 6643 5406 5998 3410 3136 6139 4580 5112 6995 7665 6270 3315 8212
##   17   18   19   20   21   22   23   24   25   26   27   28   29   31   32   33
## 7071 5539 4400 5103 5423 3072 4490 4613 2658 5119 4332 6061 4819 3415 5158 2046
##   34   35   36   37   38   39   40   41   42   43   44
## 2856 7716 2939 6280 4330 4030 4285 4532 1380 1381 1217cat("Cell types informaton")
## Cell types informaton# table(mibi.sce$tumor_group) # table(mibi.sce$immune_group) # rename the cell types mibi.sce$cellTypes <- ifelse(as.character(mibi.sce$immune_group) != "not immune", as.character(mibi.sce$immune_group), as.character(mibi.sce$tumor_group)) table(mibi.sce$cellTypes)
##
##                      B                    CD3                    CD4
##                   9134                   3867                  12443
##                    CD8                     DC                DC/Mono
##                  15787                   1275                   5052
##            Endothelial Keratin-positive tumor            Macrophages
##                   2089                 102736                  20687
##       Mesenchymal-like               Mono/Neu            Neutrophils
##                   8479                   3113                   3020
##                     NK           Other immune                  Tregs
##                    674                   6943                   1341
##                  Tumor           Unidentified
## 3177 1839mibi.sce$cellTypes_group <- ifelse(as.character(mibi.sce$immune_group) != "not immune", "Micro-environment", "Tumour") selected_chanel_mibi <- rownames(mibi.sce)[rowData(mibi.sce)$is_protein == 1]
# color for mibi cell types
cellTypes_group_mibi_color <- tableau_color_pal("Tableau 10")(length(unique(mibi.sce$cellTypes_group)))
cellTypes_group_mibi_color <- c(cellTypes_group_mibi_color, "black")
names(cellTypes_group_mibi_color) <- c(unique(mibi.sce$cellTypes_group), "Background")

cellTypes_mibi_color <- tableau_color_pal("Classic 20")(length(unique(mibi.sce$cellTypes)))
cellTypes_mibi_color <- c(cellTypes_mibi_color, "black")
names(cellTypes_mibi_color) <- c(unique(mibi.sce$cellTypes), "Background")
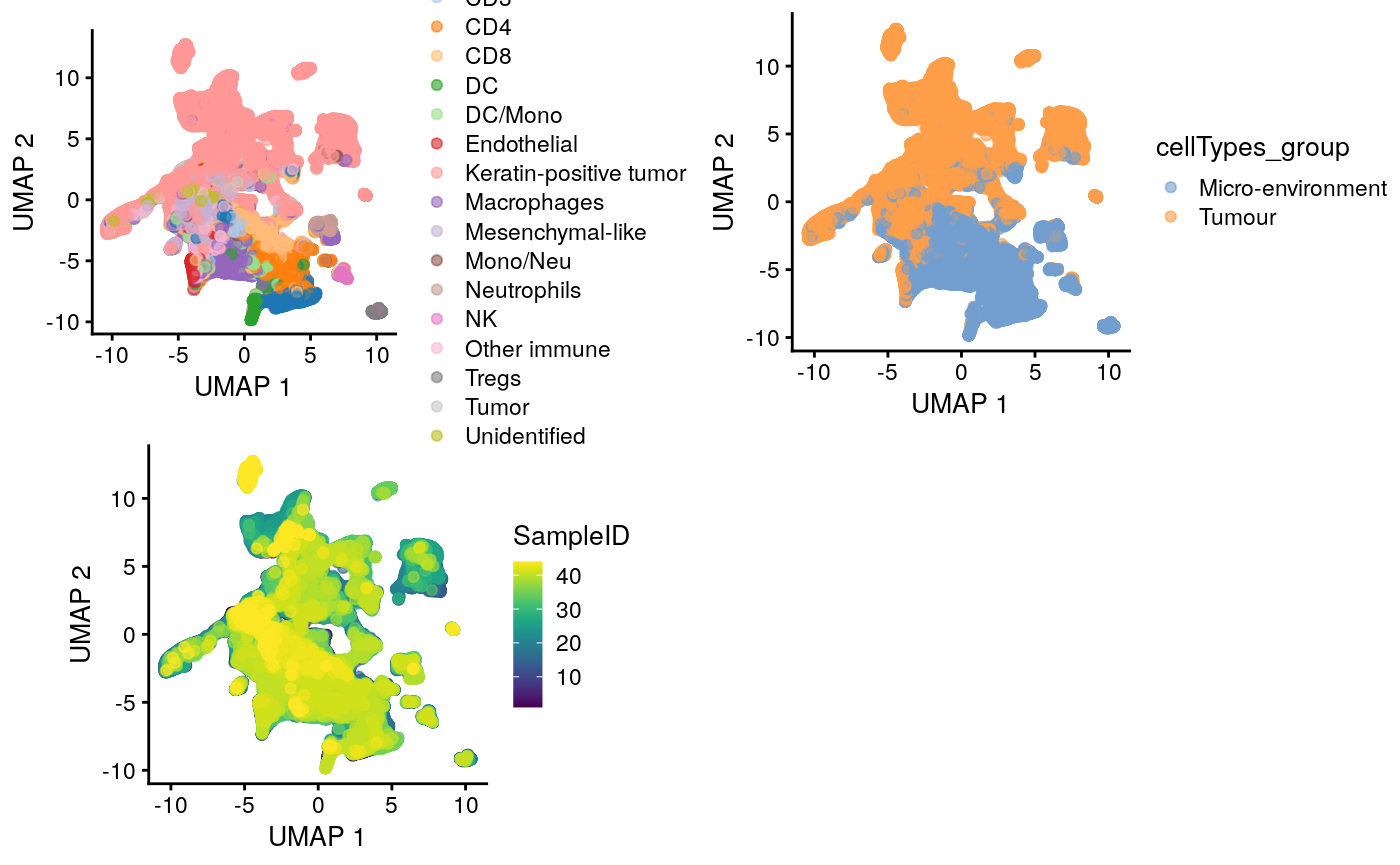
Visualising all cells using UMAP
## Dimension Reduction using UMAP
mibi.sce <- runUMAP(mibi.sce, exprs_values = "mibi_exprs",
                    subset_row = selected_chanel_mibi)
g1 <- plotUMAP(mibi.sce, colour_by = "cellTypes") +
    theme(aspect.ratio = 1)
g2 <- plotUMAP(mibi.sce, colour_by = "cellTypes_group") +
    theme(aspect.ratio = 1)
g3 <- plotUMAP(mibi.sce, colour_by = "SampleID") +
    theme(aspect.ratio = 1)

grid.arrange(g1, g2, g3, ncol = 2)
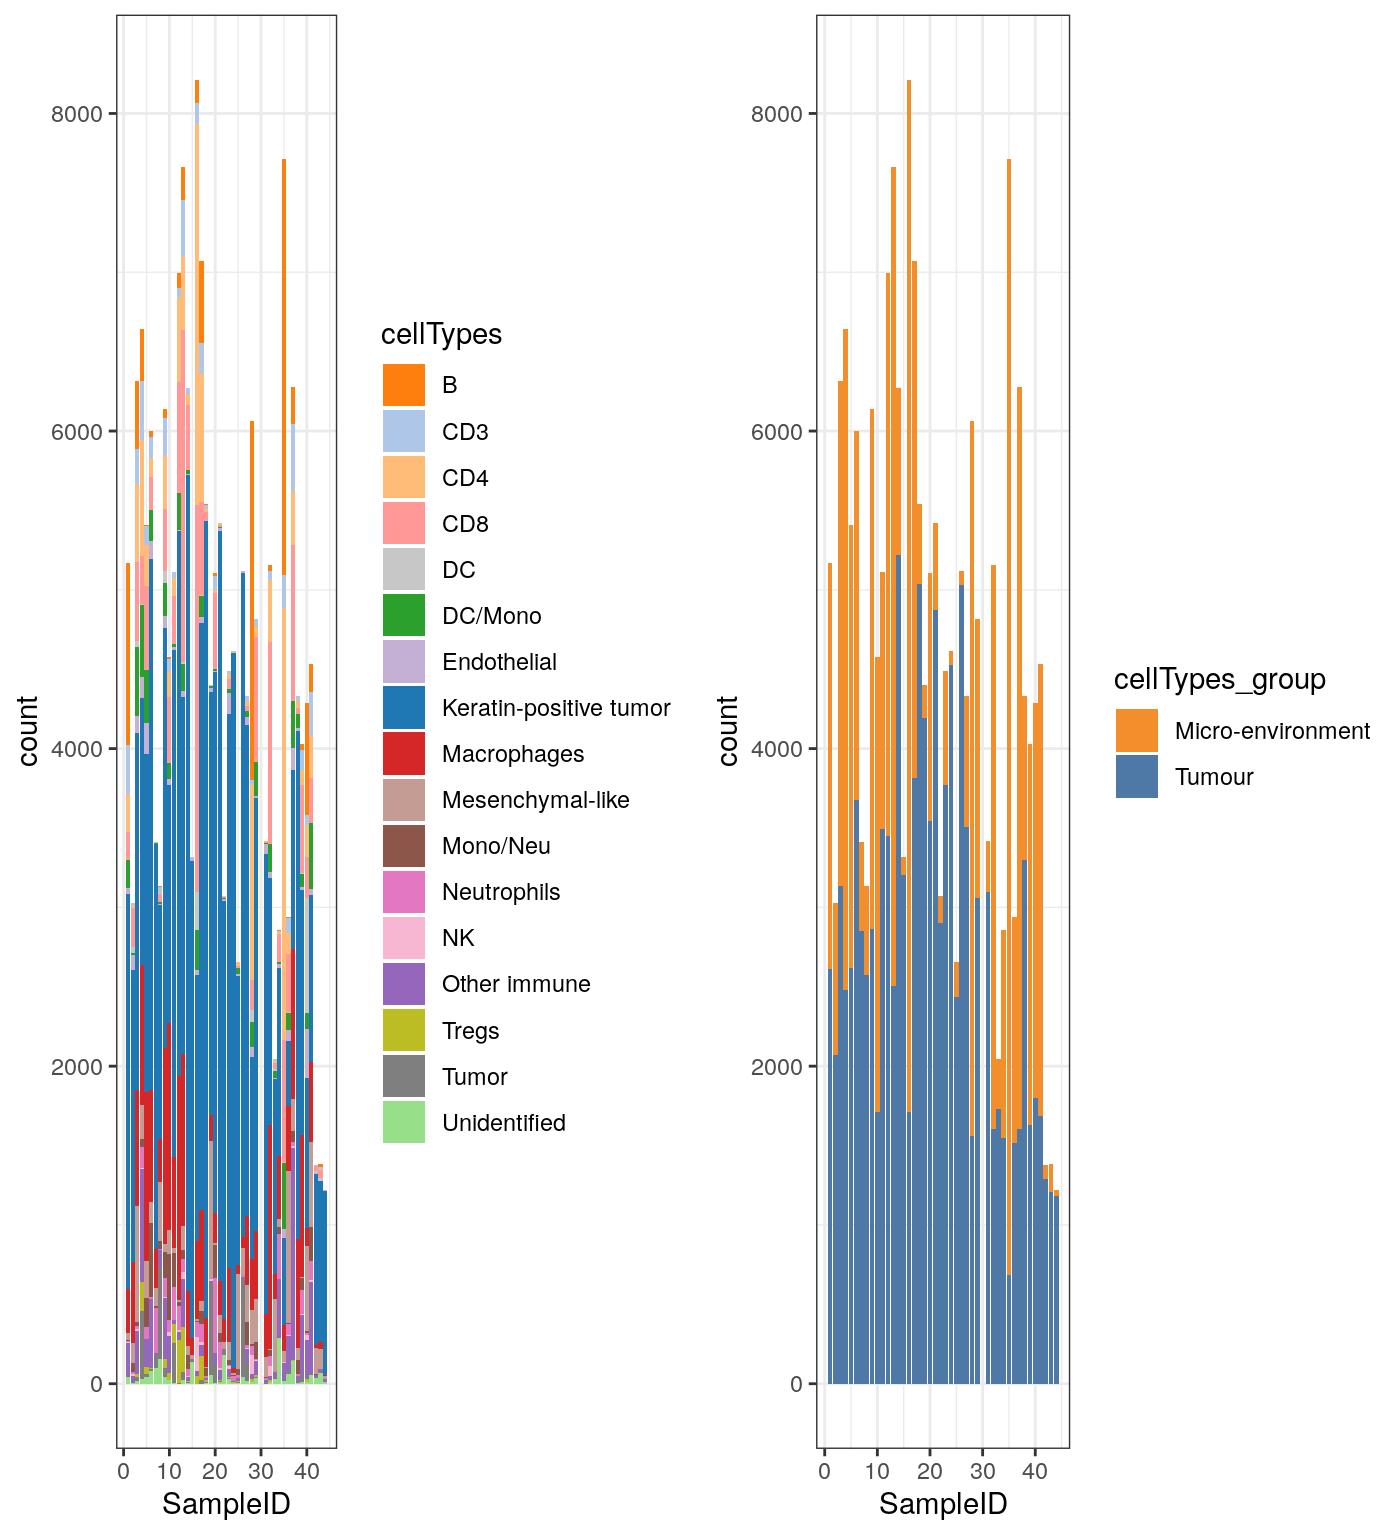
Cell type composition
df_mibi <- data.frame(colData(mibi.sce))

g1 <- ggplot(df_mibi, aes(x = SampleID, fill = cellTypes)) +
    geom_bar() +
    theme_bw() +
    scale_fill_manual(values = cellTypes_mibi_color) +
    theme(legend.position = "right")

g2 <- ggplot(df_mibi, aes(x = SampleID, fill = cellTypes_group)) +
    geom_bar() +
    theme_bw() +
    scale_fill_manual(values = cellTypes_group_mibi_color) +
    theme(legend.position = "right")

grid.arrange(g1, g2, ncol = 2)
Session Information
## R version 4.0.2 (2020-06-22)
## Platform: x86_64-pc-linux-gnu (64-bit)
## Running under: Ubuntu 20.04 LTS
##
## Matrix products: default
## BLAS/LAPACK: /usr/lib/x86_64-linux-gnu/openblas-openmp/libopenblasp-r0.3.8.so
##
## locale:
##  [1] LC_CTYPE=en_US.UTF-8       LC_NUMERIC=C
##  [3] LC_TIME=en_US.UTF-8        LC_COLLATE=en_US.UTF-8
##  [5] LC_MONETARY=en_US.UTF-8    LC_MESSAGES=C
##  [7] LC_PAPER=en_US.UTF-8       LC_NAME=C
##  [9] LC_ADDRESS=C               LC_TELEPHONE=C
## [11] LC_MEASUREMENT=en_US.UTF-8 LC_IDENTIFICATION=C
##
## attached base packages:
## [1] parallel  stats4    stats     graphics  grDevices utils     datasets
## [8] methods   base
##
## other attached packages:
##  [1] pheatmap_1.0.12             uwot_0.1.8
##  [3] spatstat_1.64-1             rpart_4.1-15
##  [5] nlme_3.1-148                spatstat.data_1.4-3
##  [7] gridExtra_2.3               raster_3.3-13
##  [9] sp_1.4-2                    plyr_1.8.6
## [11] ggridges_0.5.2              ggthemes_4.2.0
## [13] scater_1.17.4               ggplot2_3.3.2
## [15] SingleCellExperiment_1.11.6 SummarizedExperiment_1.19.6
## [17] DelayedArray_0.15.7         matrixStats_0.56.0
## [19] Matrix_1.2-18               Biobase_2.49.0
## [21] GenomicRanges_1.41.5        GenomeInfoDb_1.25.8
## [23] IRanges_2.23.10             S4Vectors_0.27.12
## [25] BiocGenerics_0.35.4
##
## loaded via a namespace (and not attached):
##  [1] bitops_1.0-6              fs_1.5.0
##  [3] RcppAnnoy_0.0.16          RColorBrewer_1.1-2
##  [5] rprojroot_1.3-2           tools_4.0.2
##  [7] backports_1.1.8           R6_2.4.1
##  [9] irlba_2.3.3               vipor_0.4.5
## [11] mgcv_1.8-31               colorspace_1.4-1
## [13] withr_2.2.0               tidyselect_1.1.0
## [15] compiler_4.0.2            BiocNeighbors_1.7.0
## [17] desc_1.2.0                labeling_0.3
## [19] scales_1.1.1              pkgdown_1.5.1
## [21] goftest_1.2-2             stringr_1.4.0
## [23] digest_0.6.25             spatstat.utils_1.17-0
## [25] rmarkdown_2.3             XVector_0.29.3
## [27] pkgconfig_2.0.3           htmltools_0.5.0
## [29] rlang_0.4.7               DelayedMatrixStats_1.11.1
## [31] farver_2.0.3              generics_0.0.2
## [33] BiocParallel_1.23.2       dplyr_1.0.1
## [35] RCurl_1.98-1.2            magrittr_1.5
## [37] BiocSingular_1.5.0        GenomeInfoDbData_1.2.3
## [39] scuttle_0.99.11           Rcpp_1.0.5
## [41] ggbeeswarm_0.6.0          munsell_0.5.0
## [43] abind_1.4-5               viridis_0.5.1
## [45] lifecycle_0.2.0           stringi_1.4.6
## [47] yaml_2.2.1                MASS_7.3-51.6
## [49] zlibbioc_1.35.0           grid_4.0.2
## [51] crayon_1.3.4              deldir_0.1-28
## [53] lattice_0.20-41           cowplot_1.0.0
## [55] splines_4.0.2             tensor_1.5
## [57] knitr_1.29                pillar_1.4.6
## [59] codetools_0.2-16          glue_1.4.1
## [61] evaluate_0.14             vctrs_0.3.2
## [63] gtable_0.3.0              purrr_0.3.4
## [65] polyclip_1.10-0           assertthat_0.2.1
## [67] xfun_0.16                 rsvd_1.0.3
## [69] RSpectra_0.16-0           viridisLite_0.3.0
## [71] tibble_3.0.3              beeswarm_0.2.3
## [73] memoise_1.1.0             ellipsis_0.3.1